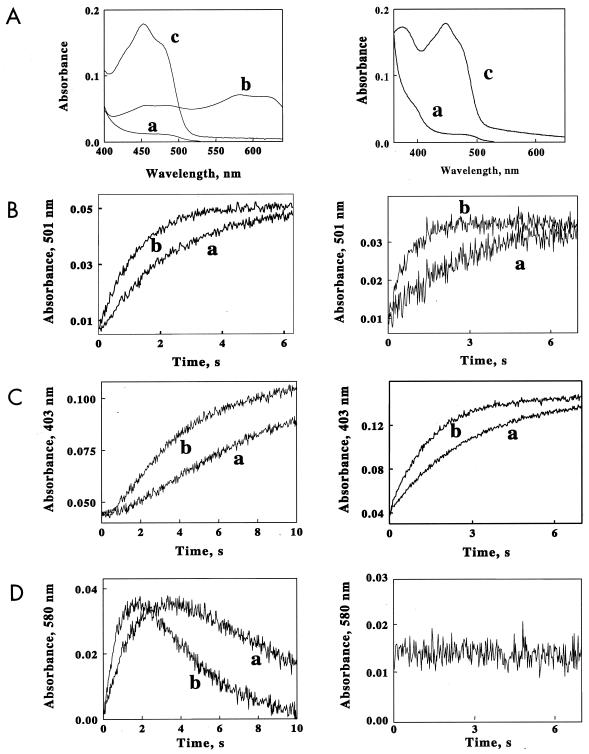
FIG. 2.
Rapid-mixing studies with ChrR and YieF. The left column presents data for the ChrR protein; the right column presents data for the YieF protein. (A) Spectra extracted from the data sets collected when ChrR or YieF (3 μM) was rapidly mixed with limiting NADH (10 μM) and an excess of chromate (40 μM). The spectra were obtained from a global fit of all the absorbance-versus-wavelength-versus-time data to a biphasic kinetic mechanism. Spectrum a, reduced enzyme; spectrum b, semiquinone form of FMN; spectrum c, oxidized enzyme. (B to D) Time courses of absorbance changes at A501 (B, showing the disappearance of the reduced enzyme), A403 (C, showing the appearance of the oxidized enzyme), and A580 (D, showing flavin semiquinone formation) when oxidized ChrR or YieF was mixed with NADH and different molar excesses of chromate. The final concentrations after mixing were as follows: ChrR, 3.0 μM; NADH, 10 μM; chromate, 20 (trace a) or 40 (trace b) μM.

