Figure 1.
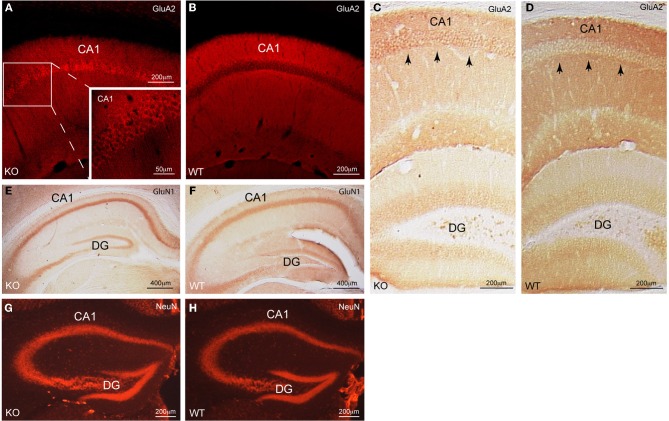
Cellular distribution of GluA2 in CA1 pyramidal neurons of Homer1 KO mice. (A,B) Immunofluorescent staining for GluA2 (red) on a saggital section of CA1 pyramidal neurons shows the differential distribution of GluA2 in Homer1 KO mice compared to WT littermates. Inset in A shows a close-up of the CA1 region and the enrichment of GluA2 immunoreactivity (red) in the pyramidal cell bodies (n = 6 mice/group). (C,D) DAB staining for GluA2 (dark brown) on a coronal section of the dorsal hippocampus shows the differential distribution of GluA2 in Homer1 KO mice compared to WT littermates. Black arrows point to pyramidal cell bodies in CA1 (n = 3 mice/group). (E,F) DAB staining for GluN1 (dark brown) on a coronal section of the dorsal hippocampus shows equal distribution of GluN1 in the pyramidal cell layer of Homer1 KO mice compared to WT littermates. (n = 3 mice/group). (G,H) Immunofluorescent staining for NeuN (red) on a coronal section, labeling neuronal cell bodies in the dorsal hippocampus of Homer1 KO and WT littermates (n = 3 mice/group). CA1, Cornu ammonis; DG, dentate gyrus, KO, knock-out; WT, wild-type.

