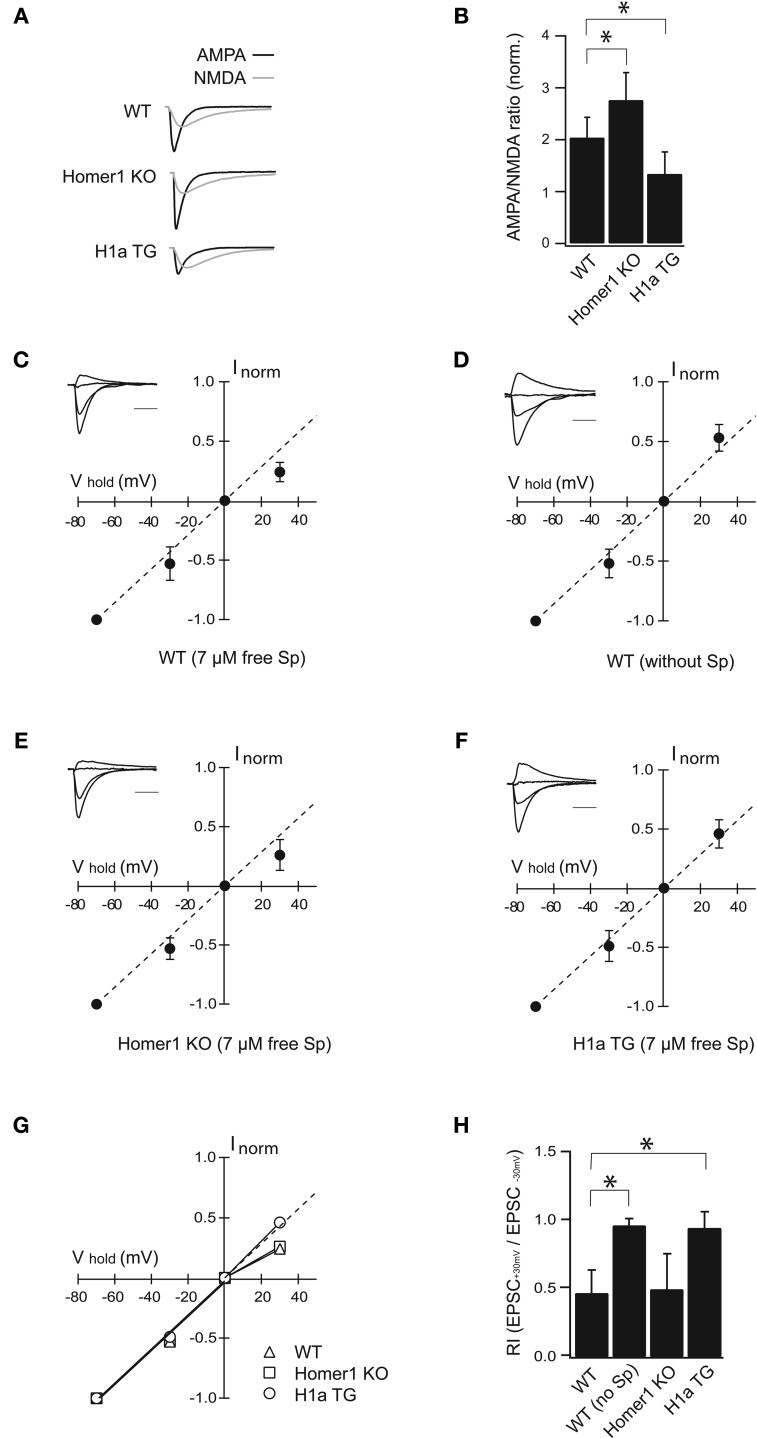
Figure 2.
H1a/Homer1 ratio alters the properties of AMPAR channels in CA1 pyramidal neurons. (A) Averaged normalized traces recorded from CA1 pyramidal neurons after extracellular Schaffer collateral stimulation show evoked synaptic AMPA (black) and NMDA (gray) currents in wild-type (WT), Homer1 knock-out (Homer1 KO) and H1aTG mice. Scale bar: 40 ms. Stimulus artefacts have been omitted for clarity. (B) Histogram represents summarized data of AMPA/NMDA current ratios showing a strong reduction in H1a TG mice compared to WT. A significant enhancement of the AMPA/NMDA current ratio is observed in Homer1 KO mice compared to WT. (C–F) I-V plots show loss of polyamine sensitivity of synaptic AMPAR-mediated currents in H1a TG (F), in comparison to WT (C). Measurements from Homer1 KO mice (E) did not show any change in polyamine sensitivity. I-V plot in panel (D) shows experiments as described in (C), but with polyamine-free intracellular solution. Recordings were performed from CA1 pyramidal neurons. Current amplitudes were measured at −70 mV, −30 mV, 0 mV, and +30 mV, respectively. Currents were normalized to the averaged amplitude of the response obtained at −70 mV. Insets represent sample traces for the given condition. The panel (G) shows summary plots of the I–V relationships from WT, Homer1 KO and H1a TG mice: the solid lines represent the linear fit to data points between the −70 and 0 mV holding potentials. The dotted line extends this fit to highlight the deviation of the I–V relationship from linearity. Bar histogram (H) shows rectification index (RI) expressed as EPSC+30 mV/EPSC−30 mV obtained from WT, WT in PA-free condition, Homer1 KO and H1a TG mice, respectively. Error bars are SD, *p < 0.05; Sp: spermine. Scale bar 20 ms; amplitudes are normalized.

