Figure 5.
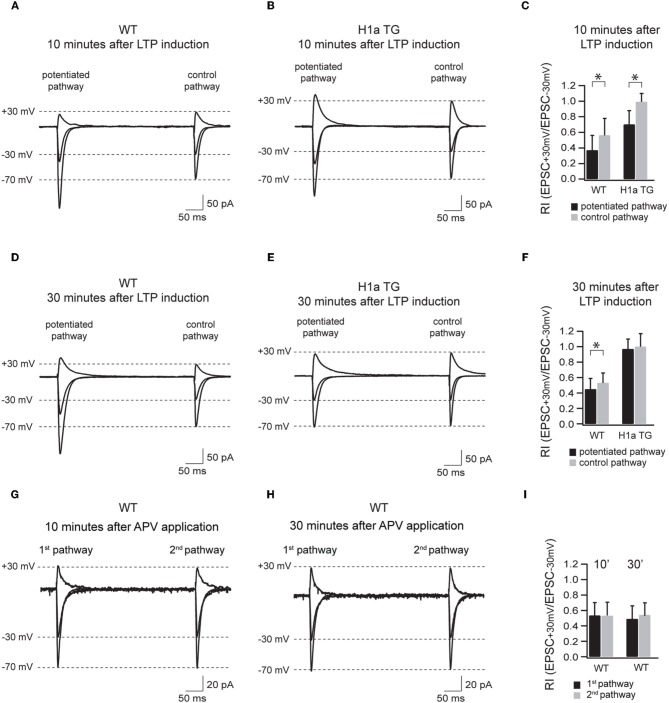
Sustained H1a expression modifies the activity dependent incorporation of GluA2 subunit containing synapses. Panels (A–F) show the AMPAR-mediated currents of the potentiated and control pathway 10 min after LTP induction (the “pairing” protocol) recorded from WT and H1aTG mice. Bar histogram (C) shows the summary of the rectification index (RI+30 mV/−30 mV) measured 10 min after LTP induction. Panels (D–F) show the same recording conditions performed 30 min after LTP induction. Note the constitutive expression of non-rectifying AMPARs both 10 min (B) and 30 min (E) after LTP induction measured from H1a TG mice. Panels (G–I) show the AMPAR-mediated currents of the two non-potentiated pathways recorded in WT within 10 min (G) and 30 min (H) after APV application. Bar histogram (I) shows the summary of the rectification indices (RI+30 mV/−30 mV) measured at 10 and 30 min, respectively. Shown traces represent the overlay of the averaged evoked EPSCs recorded at −70 mV, −30 mV, and +30 mV, respectively. Stimulus artefacts have been omitted for clarity. Error bars are SD, *p < 0.05.

