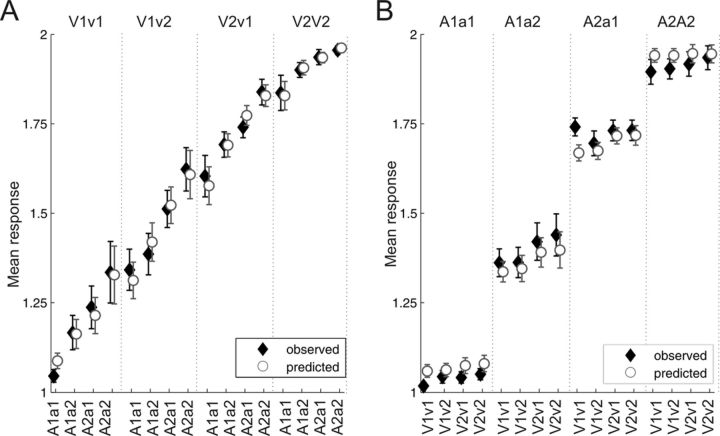
Figure 4.
The perceived number of flashes and beeps is well predicted by a weighted sum of the events in the two within- and two across-modality streams. A, Counting flashes—the mean (±SE) number of flashes for all AV combinations. Solid symbols show behavioral results, while open symbols show predictions using the weights derived from a linear regression. The visual stimulus condition is listed at the top of the figure; each column of four data values presents the same combination of flash stimuli, while the four points within each column represent the four possible combinations of beeps (listed at the bottom of the figure). B, Counting beeps—the mean (±SE) number of beeps for all possible AV combinations.

