
Figure 6.
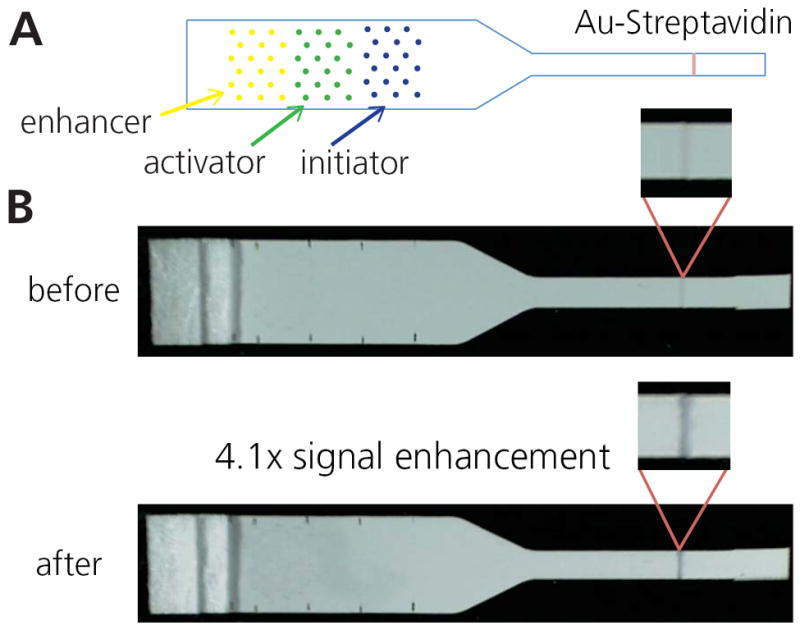
Combining gold enhancement reagents patterned on strip. A) Schematic of patterning. Yellow=enhancer, green=activator, blue=initiator. Spots were arrayed for minimal disruption to flow. B) Images of pre- and post-enhancement of a 1.25 OD gold-streptavidin line. After running for 30 minutes, the enhanced signal was 4.1x the initial signal, using grayscale intensity.