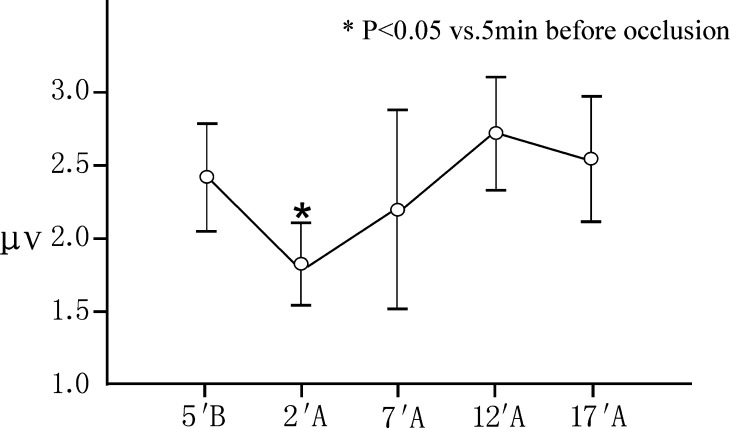
Fig. 2.
Changes in P40 amplitudes (peak to peak) after occlusion of the segmental vessels(mean±standard deviation, n=31). A, after occlusion; B, before occlusion. Contrasted to 5 min before occlusion, the P40 amplitudes at 2 min after occlusion significantly declined 0.64 μV (26%) on average (P<0.05). But the P40 amplitudes at 5 min before occlusion and 7, 12 and 17 min after occlusion showed no significant difference (P>0.05)

