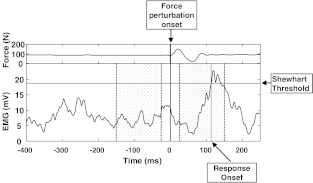
Fig. 2.
Sample recording of an EMG signal from a perturbation experiment. The upper panel shows the force recording, that defined the force perturbation onset time (that defined zero time). Relative to this time, pre-perturbation and post-perturbation ‘windows’ (shaded) were defined, and used to calculate the MEMGD. The EMG activity prior to the perturbation defined the Shewhart threshold used to identify the EMG response onset that occured here 113 ms after the perturbation onset

