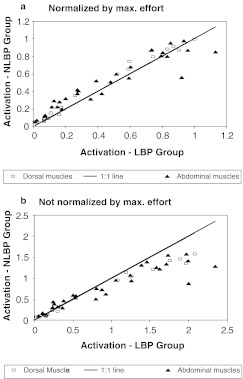
Fig. 3.
Relationship between groupwise averages of the muscle activation in ramped-maximum-effort tests. Each point on the graphs represents the mean for one muscle/angle permutation. aUpper: For activation normalized by both maximum EMG and maximum effort: 15/20 of points for dorsal muscles (squares) and 23/30 points for the abdominal muscles (triangles) lie to the left of the 1:1 (equality) line, indicating that on average the subjects in the LBP group employed lesser muscle activation. bLower: Activation normalized by maximum EMG only: 18/20 points for dorsal muscles (squares) and 18/30 points for abdominal muscles (triangles) lie to the right of the 1:1 (equality) line, indicating that on average the subjects in the LBP group employed greater muscle activation

