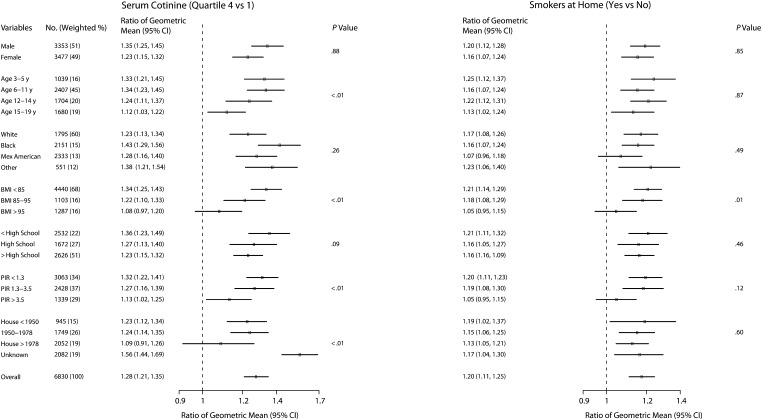
FIGURE 1.
Ratio of geometric mean of blood lead level, by children's and adolescents' secondhand smoke exposure and other characteristics: National Health and Nutrition Examination Survey, United States, 1999–2004.
Note. BMI = body mass index (defined as weight in kilograms divided by the square of height in meters); CI = confidence interval; Mex = Mexican; PIR = poverty-to-income ratio. Ratios are adjusted for gender, age, race, country of birth, BMI percentile, survey year, household education, poverty level (PIR; the ratio of the family's income to its appropriate poverty threshold as defined by the US Census Bureau), and year in which housing was built. Dots represent the ratios and horizontal lines represent the CIs. The P value is for the difference in the association between secondhand smoke exposure (cotinine or smokers at home) and blood lead levels by participant subgroups (interaction).

