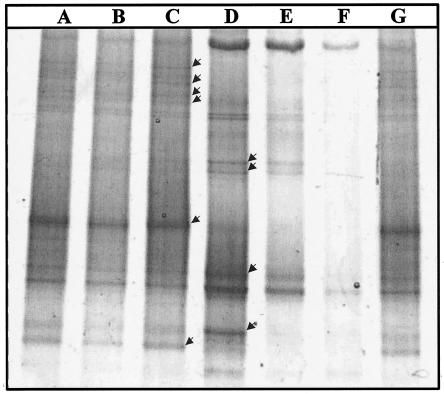
FIG. 4.
Temporal changes in the DGGE band patterns obtained for PCR products resulting from the amplification of a 592-bp fragment of the g20 gene in the cyanophage community of Lake Bourget. Arrows indicate the principal differences between the September-October and November band patterns. Lanes: A and G, mix of September-October samples; B, September sample; C, October sample; D, November sample; E, December sample; F, January sample.

