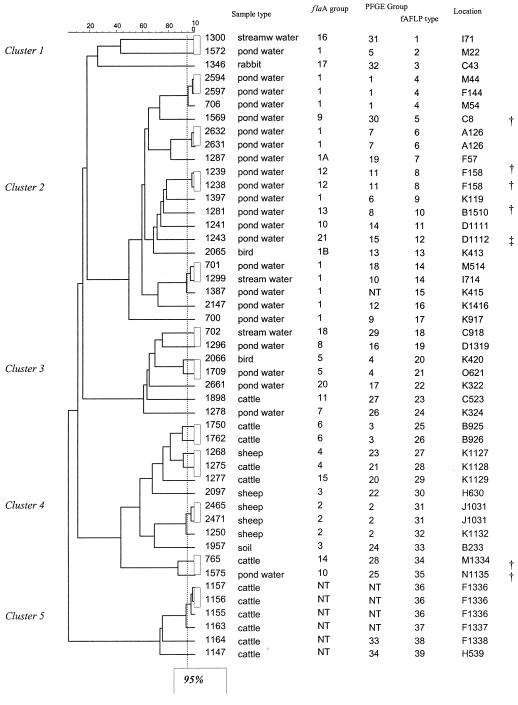
FIG. 4.
fAFLP dendrogram for C. coli isolates and a comparison with the flaA and PFGE groups. The 95% similarity cutoff for the fAFLP method is indicated by the dotted line. Forty-seven C. coli isolates representing every combination of sample type, flaA group, and PFGE group were analyzed by this method; four isolates which could not be typed by either method were also included. An internal control was included to ensure gel-to-gel reproducibility (results not shown). NT, not typeable. The daggers indicate isolates that produced unusually large flaA products, while the double dagger indicates an isolate that produced an unusually small flaA product.

