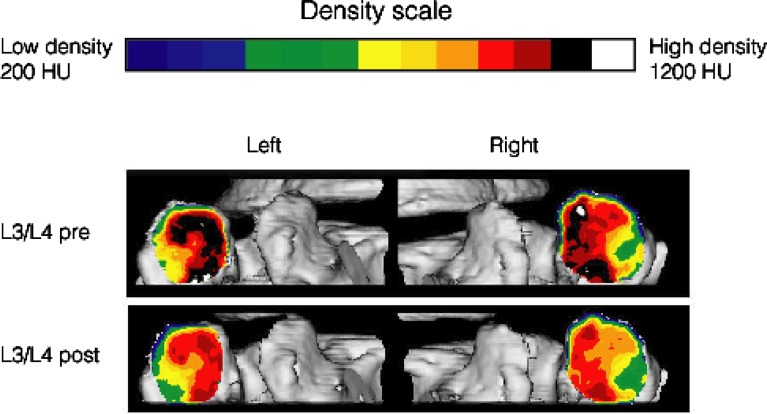
Fig. 2.
3D colour map of facet joint subchondral bone density produced by CT osteoabsorptiometry at the pre-operative and 6-month post-operative visits. The dorsal aspects of the left and right facet joints at L3/L4 for patient 4 are shown. The distribution of the areas of maximum subchondral bone density were unchanged after 6 months. The overall bone density, however, decreased uniformally

