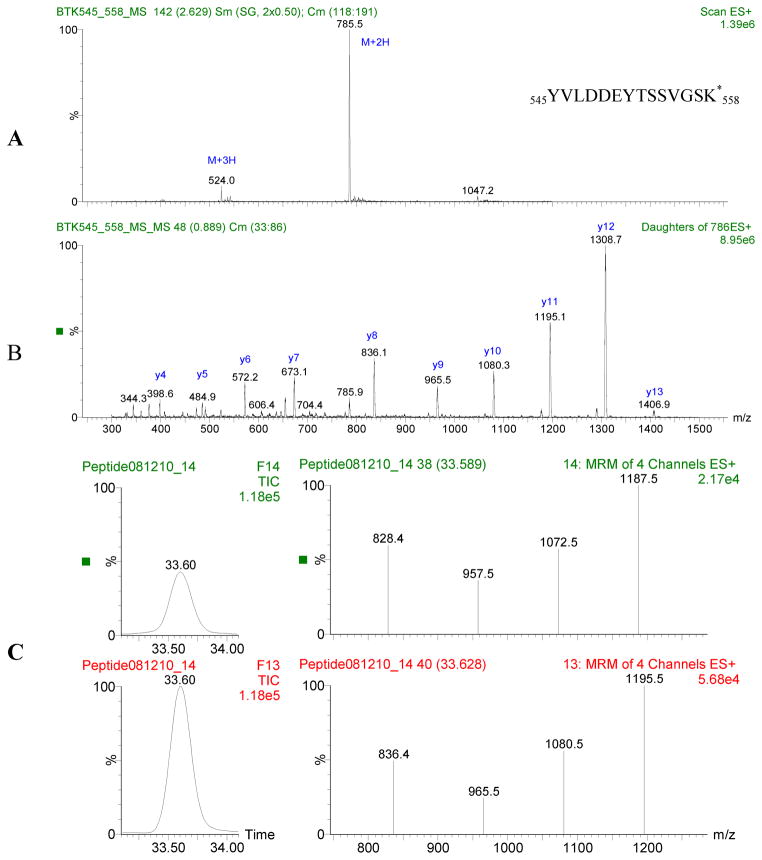
Figure 1.
A: Mass spectrum of labeled BTK 545:558. B: Tandem mass spectrum of 2+2H2+. Abundant fragment ions are selected and optimized for MRM analysis. C: Chromatogram and MRM spectrum for BTK 545:558 peptide. Top panel is signature peptide found in lymphocyte cell line extract, bottom panel is the isotopically labeled internal standard. Chromatographic peaks overlap and MRM patterns are comparable.

