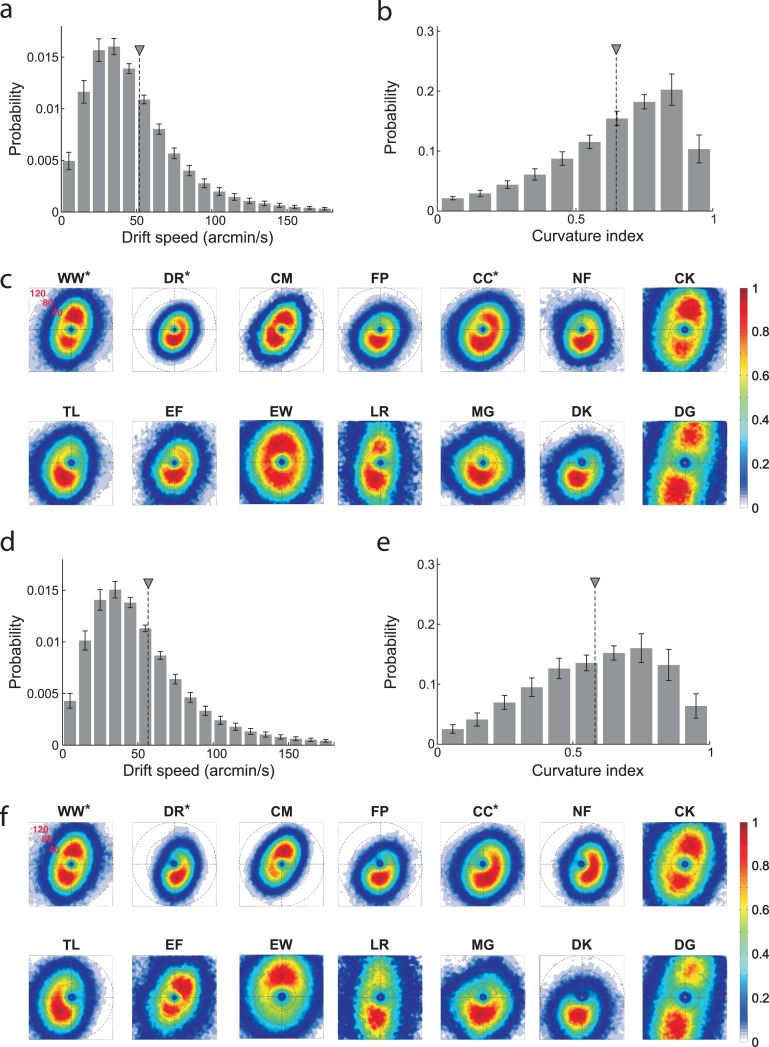
Figure 4.
Characteristics of ocular drift. (a, b) Average probability distributions across all observers of (a) drift speed and (b) index of curvature in the marker condition. Error bars represent SEM. Triangles indicate mean values. (c) 2D probability distributions of instantaneous drift velocity for individual observers in the marker condition. Maps are in polar coordinates. Color codes the probability of occurrence of instantaneous drift velocity with given direction and modulus. (d-f) same as in (a-c) for the no-marker condition.

