
Fig. 4.
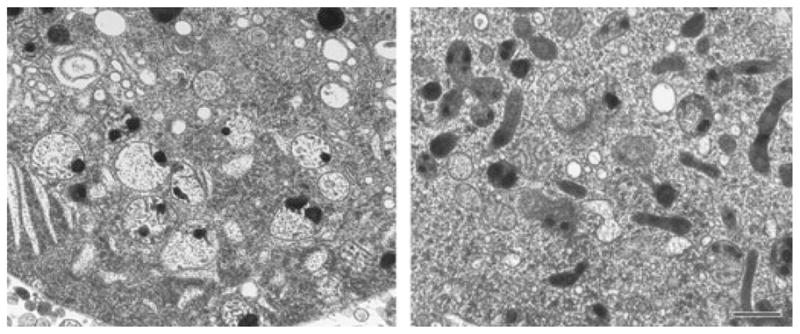
The variability of mitochondrial calcium loading capacity. Electron micrographs of high pressure-frozen, freeze-substituted, hippocampal neurons from naïve (left panel) and NMDA-tolerant (‘pre-conditioned’ [84]) cultures (right panel) after exposure to 100 μM NMDA. There are few swollen, damaged mitochondria in the tolerant cell, even though the calcium load is large and comparable to that in naive cells. This damage resistance reflects a general, experimentally induced increase in the calcium loading capacity. Scale bar = 500 nm (both panels).