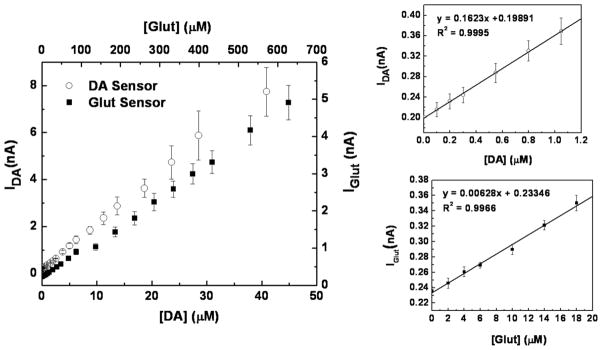
Figure 6.
Dual mode Glut/DA sensor calibration curves for Glut and DA. The smaller plots show the lower concentration ranges for each analyte. The calibrations were performed by successive injections of known Glut or DA solutions into the well-stirred cell with sensors at a constant potential of 0.7 V (vs. Ag/AgCl) in 50 mM PBS, pH 7.4.

