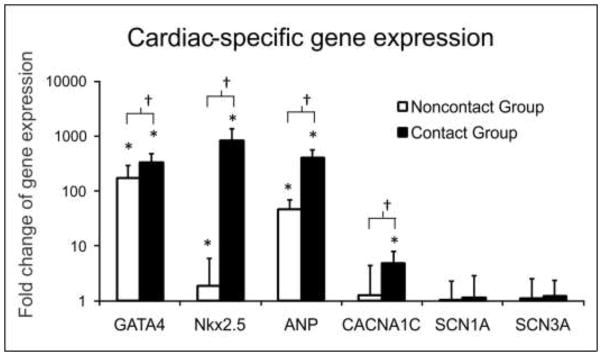
Figure 6.
RT-PCR analysis of cardiac-specific gene expression of the rMSCs from contact and noncontact groups relative to that of an rMSC control group (1 fold). *The gene expressed was significantly upregulated compared to the control group (p < 0.005); †The gene expressed in contact groups was significantly upregulated compared to noncontact groups (p < 0.01).

