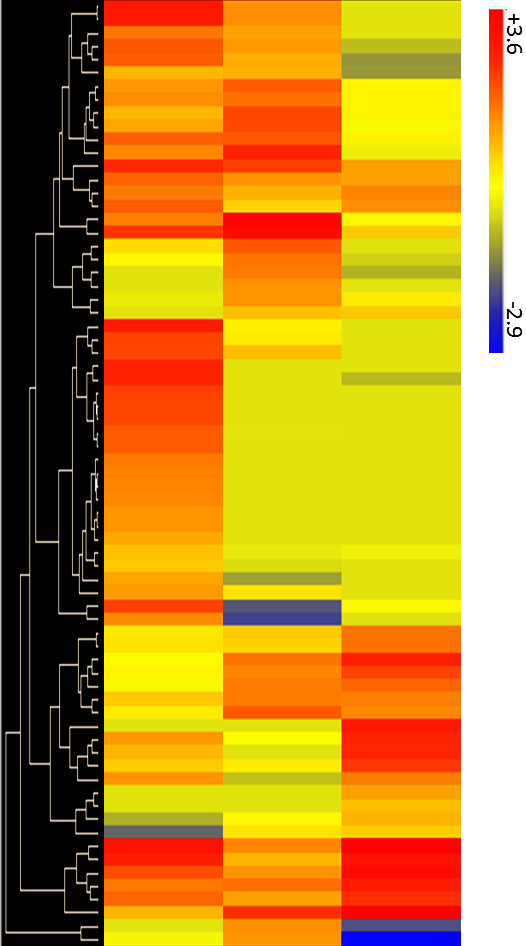
Figure 2.

Heat map showing overall expression patterns of differentially regulated genes from up-regulated libraries. Hierarchical clustering of significantly MJ up-regulated genes was performed using average linkage and Euclidean distance as a measurement of similarity. Only results from probes showing a statistically significant change in expression for at least one time point (P < 0.05) are shown.
