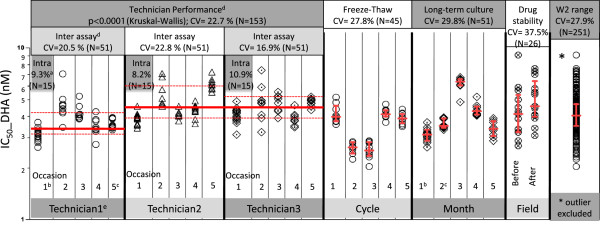
Figure 1.
HRP-2 ELISA assay variability for the W2 Plasmodium falciparum parasite clone. Each data point represents an individual IC50 value obtained from triplicate columns on each of three or five drug-coated plates, generating nine or 15 IC50 values per experiment/occasion. For the drug stability experiment under field conditions, ODs from duplicate columns were averaged to generate a single IC50 value for each plate, producing 26 IC50 values for 26 assays run. All individual IC50 values are presented in the “W2 Range” column. Red lines represent median IC50s and interquartile ranges. (a) ‘Intra-assay’ variability is assessed by% CV of IC50 values within each HRP-2 assay conducted by a single technician on a single day. (b), (c) IC50 values measured from the same experiment were analysed in both the intra/inter-assay variability and long-term culture variability. (d) ‘Inter-assay’ variability was assessed by the % CV of IC50 values among HRP-2 assays conducted on different days by the same technician, while technician performance was assessed by the difference in IC50 values among technicians. (e) IC50 values obtained from technician 1 were significantly lower than those from technician 2 and 3.

