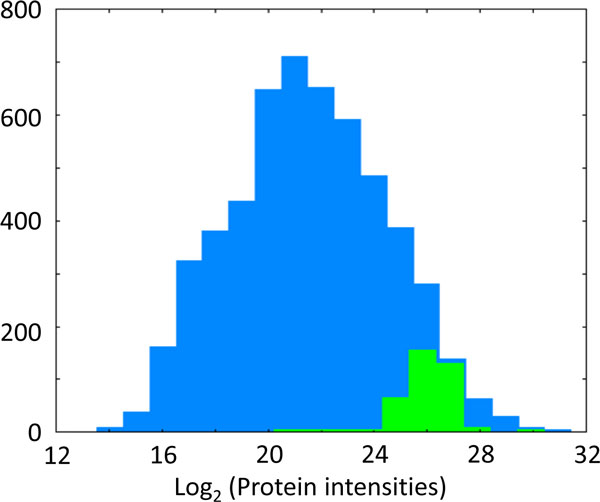
Figure 1.
Histogram of log protein intensities for all mouse proteins quantified in dendritic cells in Luber et al[3](blue). The green histogram indicates the ribosomal proteins within this distribution. They are significantly enriched at large values. Heights of the green bars were multiplied by five for better visibility.

