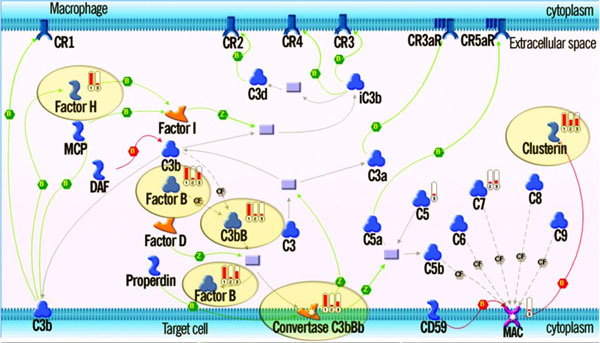
Figure 4.
Complement pathway activation in glaucomatous optic nerve astrocytes revealed by proteomics. The relevant proteomic data (solid red indicator #1) and the differential gene expression data (indicators #2 and #3), mapped on the canonical pathway originally characterized in macrophages, show cross-verification of the complement pathway activation in glaucomatous ONHAs. Pathway steps confirmed by both data types are highlighted with ovals.

