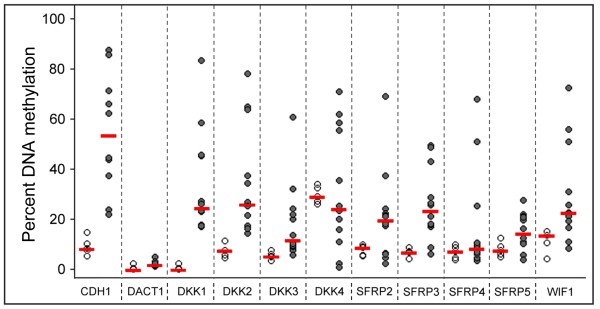
Figure 2.
Methylation of the inhibitor genes in patient CLL samples. Methylation in tumour cells (filled circles) and control CD19+ B cells (empty circles) were analysed by bisulphite pyrosequencing. Each circle indicates the methylation degree of a particular sample. Horizontal bars denote the median methylation level for the patient group or the healthy donors, respectively.

