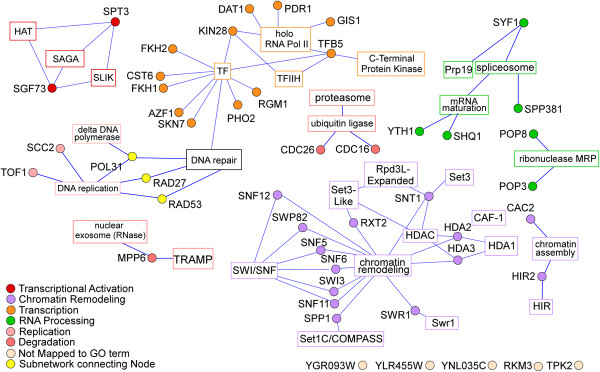
Figure 2.
Graphical representation of protein-protein interaction networks for the nuclear proteins that localized to the cytosol in response to hypoxia in a shorter time period. The information on the biochemical interactions and complex formation of the 48 faster responding nuclear proteins (listed in Table 1) was downloaded from the SGD database, and then imported to Cytoscape for network construction. The proteins are shown as round nodes in different colors based on their cellular functions. The GO terms for protein complexes or functional categorizations are indicated and are shown in square nodes. Nodes of the same sub-networks are colored similarly, and a key for the coloring of the nodes is shown. Lines represent an association of the protein to a particular complex or functional GO term.

