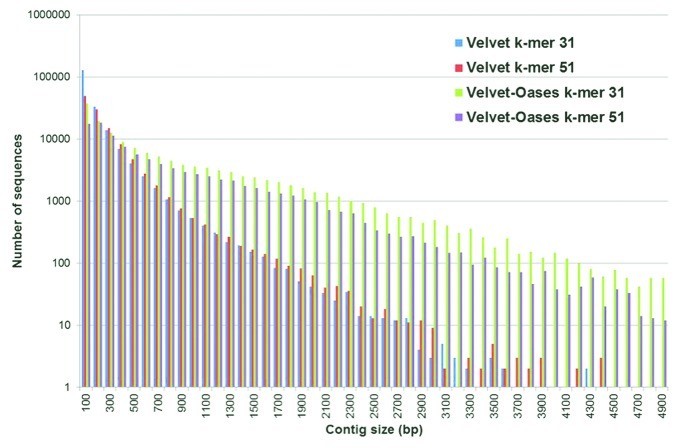
Figure 1. Size distribution of the assembled transcripts after Velvet and Oases analyses with different k-mer settings. The histogram represents the number of sequences of a particular contig size. The different colors show the output of Velvet or Velvet-Oases with different k-mer settings. The Velvet-Oasis combination with k-mer setting 31 results in the highest number of long contigs.

An official website of the United States government
Here's how you know
Official websites use .gov
A
.gov website belongs to an official
government organization in the United States.
Secure .gov websites use HTTPS
A lock (
) or https:// means you've safely
connected to the .gov website. Share sensitive
information only on official, secure websites.
