
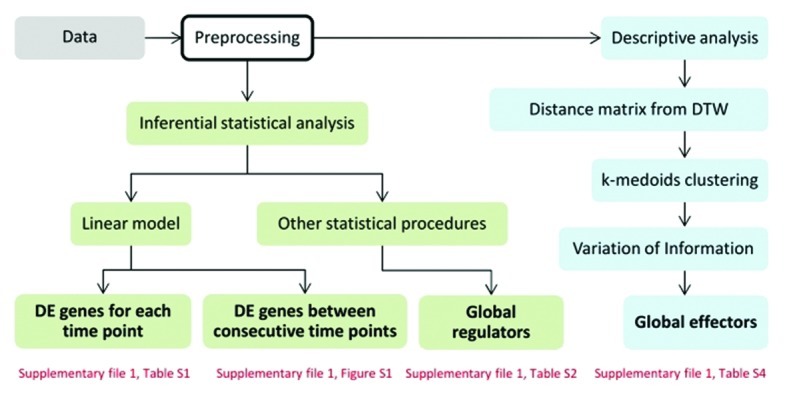
Figure 1. Workflow of the analysis. Two types of analyses were conducted on the preprocessed control and treatment data - inferential and descriptive - depicted by green and blue color, respectively. Text in bold shows the result of the respective process and the text in red indicate tables and figures containing the results.