Figure 5.

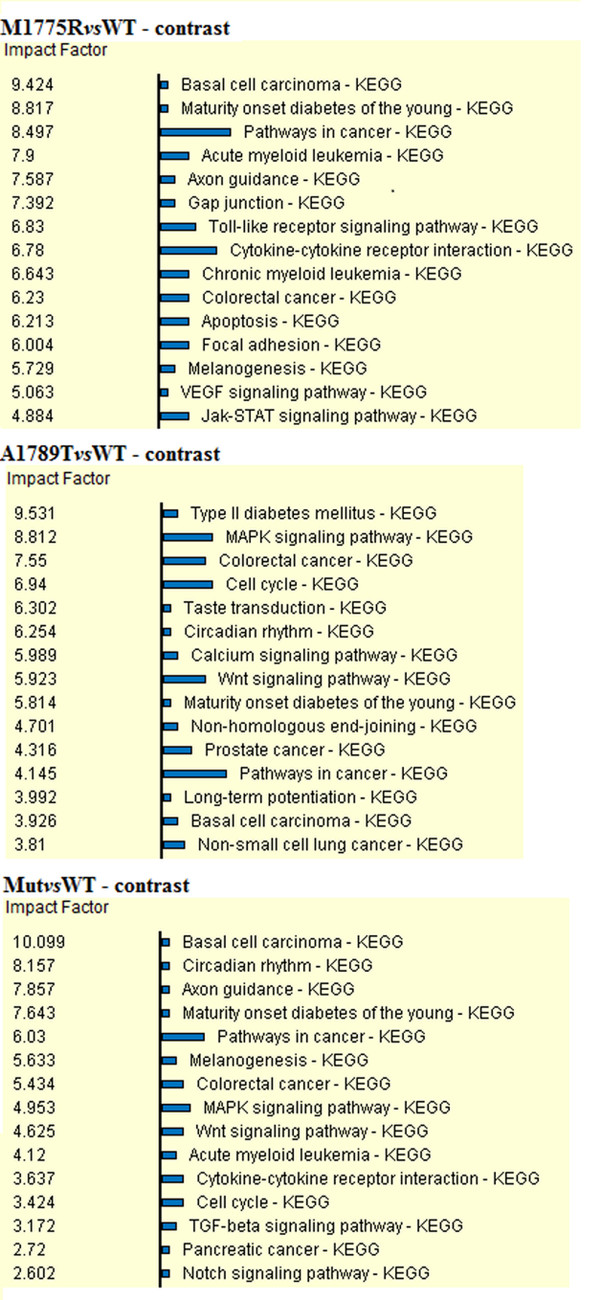
Diagram showing the top fifteen most impacted pathways for each contrast. The blue bar is proportional to the number of DEGs mapped in each pathway.

Diagram showing the top fifteen most impacted pathways for each contrast. The blue bar is proportional to the number of DEGs mapped in each pathway.