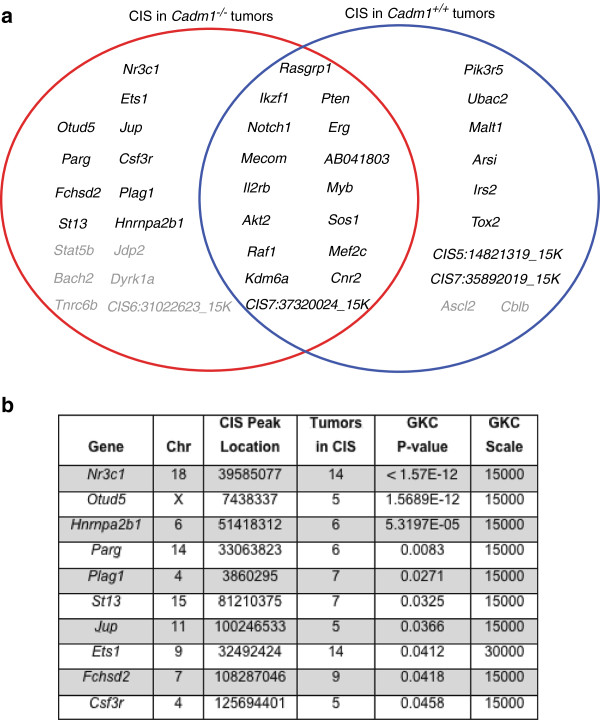
Figure 4.
Common insertion sites (CIS) found in the leukemia/lymphoma cases from Cadm1 mice. Gaussian kernel convolution (GKC) CIS were called as detailed in the Materials and Methods (Additional file 1). a. Venn diagram showing the CIS found in the leukemia/lymphoma cases from Cadm1 +/+ (blue circle) and Cadm1 −/− (red circle) mice. CIS shown in black are those with a genome-wide adjusted P-value of <0.05, and CIS shown in grey are those also present in the opposite genotype but at a genome-wide adjusted P-value of >0.05. CIS that are not located within ± 150 K base pairs of a gene are given the label ‘CIS’ followed by the chromosome and the peak location of the Gaussian kernel. b. Details of the CIS (with a genome-wide adjusted P-value of <0.05) found only in tumors from Cadm1 −/− mice, thus representing Cadm1 null-specific CIS. ‘Tumors in CIS’ is the number of individual tumor samples (mice) that contained insertions in the gene/CIS region.

