Figure 6.

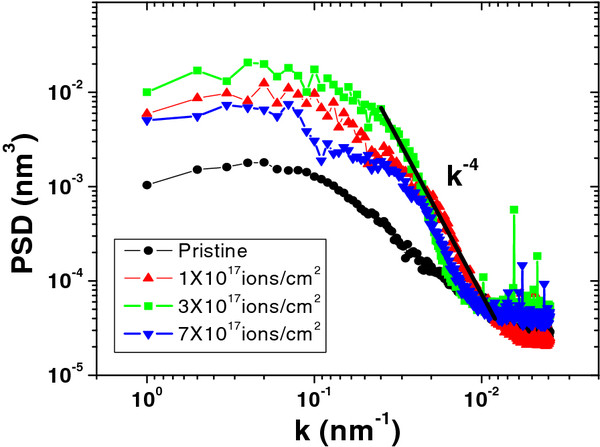
Log-log plot of 1D-PSD spectral density as a function of spatial frequency. This was obtained from AFM micrographs for pristine and for irradiated GaAs samples at different fluences.

Log-log plot of 1D-PSD spectral density as a function of spatial frequency. This was obtained from AFM micrographs for pristine and for irradiated GaAs samples at different fluences.