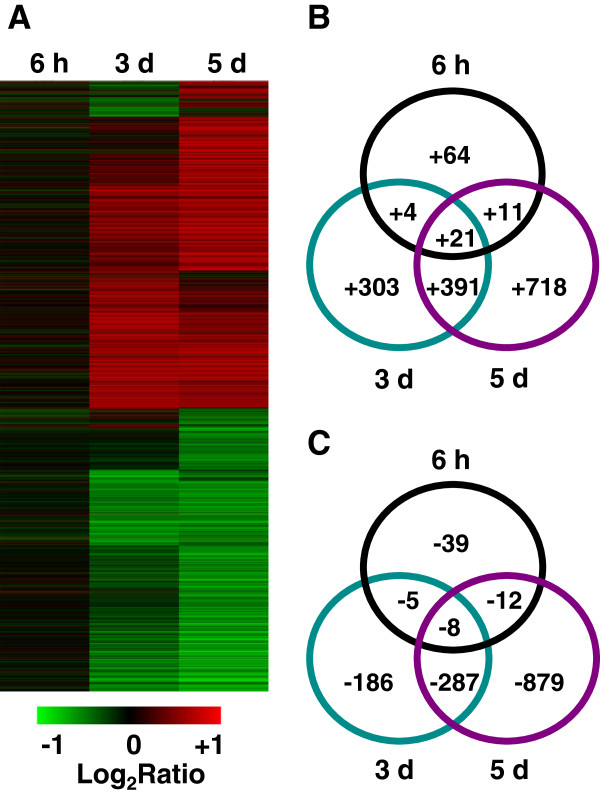
Figure 3.
Hierarchical cluster analysis and Venn diagrams of rice genes showing transcriptional changes in response to K+ deficiency. (A) Hierarchical cluster analysis of genes showing transcriptional changes at indicated times (6 h, 3 d and 5 d) during K+ deficiency. (B, C) Venn diagrams of up- (B) and down- (C) regulated genes at different LK-treated times. The genes up-regulated at least at one time point were selected for the analysis in (B). Meanwhile, the genes down-regulated at least at one time point were selected for the analysis in (C).

