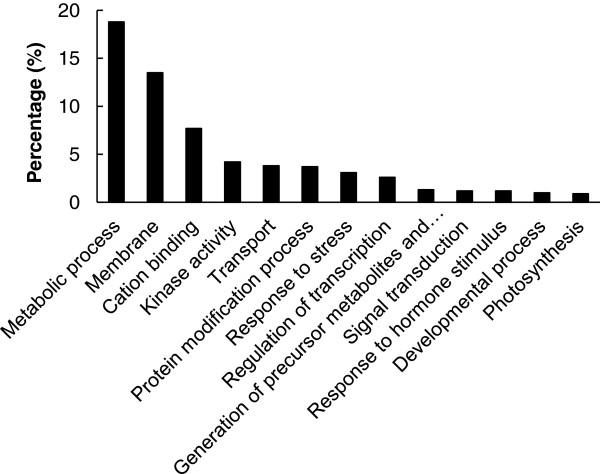
Figure 4.
Functional category distribution of rice genes showing transcriptional changes in response to K+deficiency. AgriGO web-based tool was used to analyze GO categories of genes showing changes in transcription levels. Percentages of genes showing transcriptional changes in 13 main biological categories are shown.

