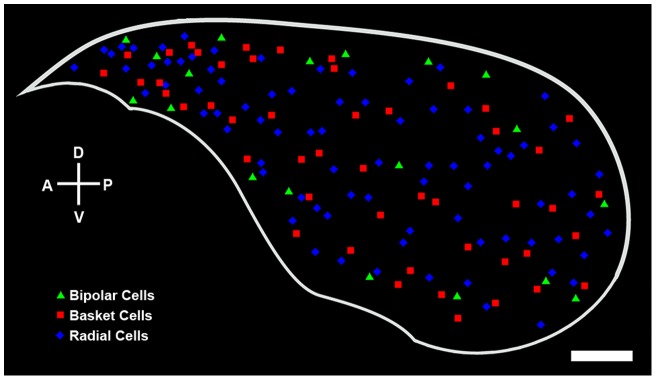
Figure 7. A three-dimensional reconstruction of the dLGN, which has been generated by stacking the coronal drawings of the dLGN in Figure S1 from anterior to posterior at 120 µm intervals and then mapping them in two dimensions, showing the spatial distributions of radial (blue diamonds), basket (red squares), and bipolar (green triangles) projection neurons.
A: anterior, P: posterior, D: dorsal, V: ventral. Scale bar: 250 µm.

