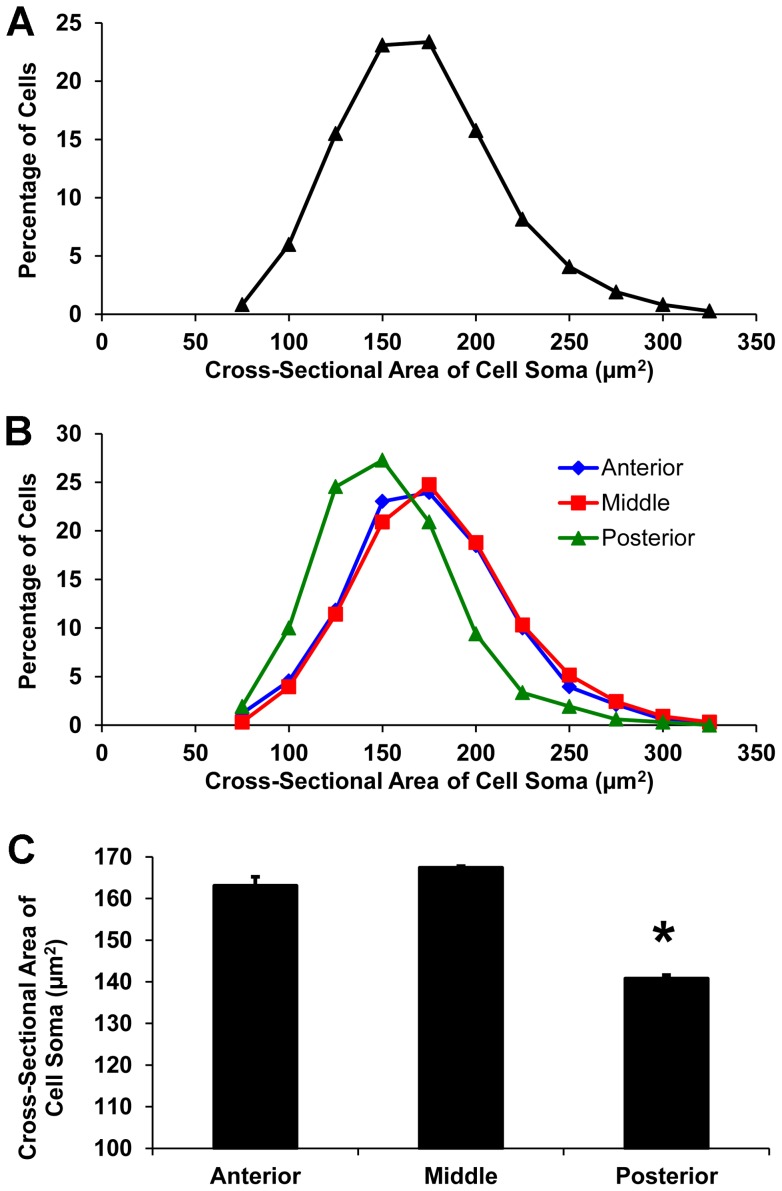
Figure 9. Cell soma size of dLGN projection neurons.
(A) Frequency distribution of cell soma size. (B) Frequency distributions of cell soma size at three anterior-posterior planes of the dLGN: anterior (blue diamonds), middle (red squares), and posterior (green triangles). (C) Mean cell soma size at each of the three planes. The asterisk indicates that the mean cell soma size of projection neurons in the posterior plane of the dLGN is significantly smaller than that of cells in the middle or anterior level of the nucleus, p<0.01, two-tailed Student's t-test.

