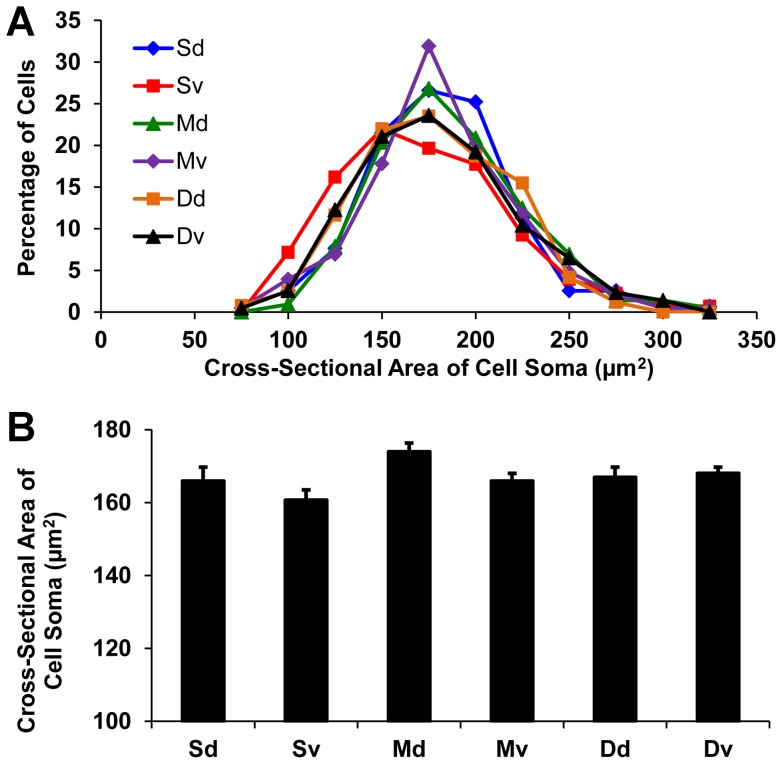
Figure 10. Cell soma size of dLGN projection neurons at six sectors near the rostro-caudal midpoint of the nucleus ( Figure 1B ).
(A) Frequency distributions of cell soma size in each sector. (B) Mean cell soma size in each sector. No statistically significant differences were detected between any of the sectors that were analyzed.

