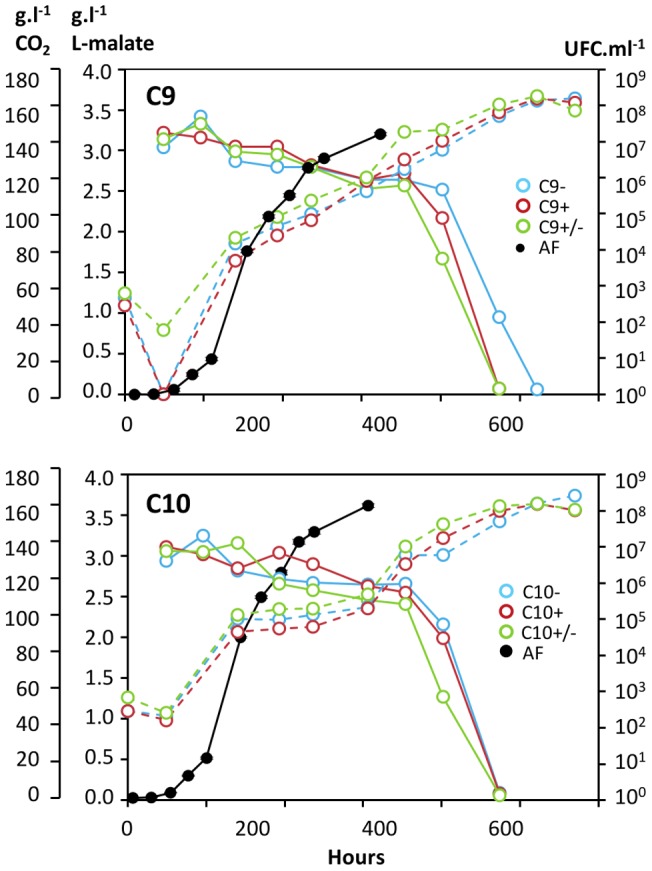
Figure 5. Comparison of growth in wine of isogenic strains with/without plasmids.

Kinetics of alcoholic fermentation (CO2 released, dark line), MLF (colored solid lines) and bacterial populations (colored dotted lines) were monitored in a sterile grape must inoculated with industrial wine yeasts and 103.ml−1 bacteria carrying pOENI-1 or pOENI-1v2 (red lines), bacteria without plasmids (blue lines) or a mixture of both (green lines). Kinetics of AF (dark symbols) is the mean of the three experiments.
