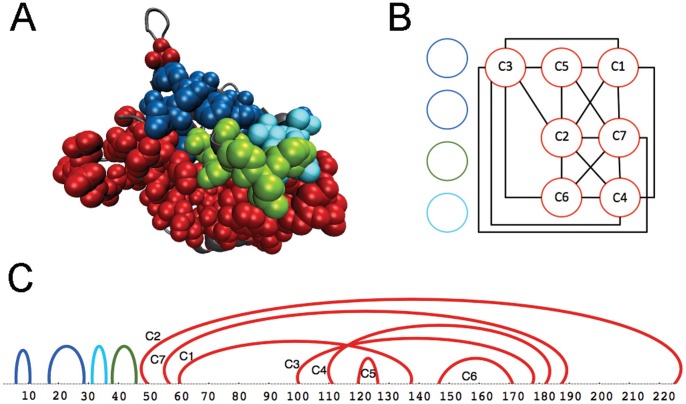
Figure 3. Partitions in protein MukB (Escherichia coli K12).
Coevolution analysis, realized on a dataset of 200 sequences, detects 11 clusters at dimensions  . The dataset is the same as the one used in Fig. 2. A: MukB structure (1qhl:A) with coevolving clusters: in green, the Walker-A motif; in blue, clusters C1, C2 and C8 that sit on the left hand side of the Walker-A motif; in red, all clusters sitting on the right hand side of the Walker-A motif. B: interval graph of C. It is constructed by setting each interval in C to be a node of the graph and by defining an edge between two nodes when the corresponding intervals overlap or cross each other. A connected component (red) forms a partition located on the bottom of the structure in A. C: protein sequence corresponding to the structure in A (SI Text S3 and Text S15); arcs highlight intervals along the sequence hosting clusters, where an interval associated to a cluster is identified (with an arc) by using the smallest and the largest positions among all blocks in the cluster. Color code as in A. The 11 clusters have been obtained by imposing very stringent parametric conditions to coevolution analysis. More relaxed analysis conditions (with blocks defined for larger dimensions
  , and clustering done with larger
  values; see Methods) still detect the Walker-A and partitions remain located on its left and right hand sides.

