
Figure 4.
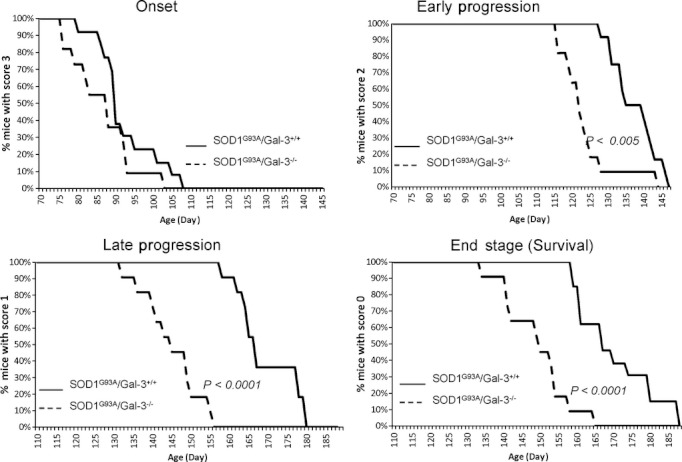
Progression of motor neuron disease is more rapid and life span is decreased in C57BL6 SOD1G93A/Gal-3−/− mice (n = 12) compared with C57BL6 SOD1G93A/Gal-3+/+ controls (n = 12). A neurological assessment rating scale from score 4 (no visible sign of disease) to 0 was used to assess disease progression. Each graph represents the % of mice with scores 3 through 0 for each genotype over time, where 3 = altered hind limb extension/tremors on suspension by the tail (aka failed “splay” test), but otherwise visually normal, 2 = deficits on “splay” test and additional functional tests (grip, activity, or rotarod), but no visually obvious abnormalities; 1 = deficits on all tests and visually observable uni- or bilateral paralysis; and 0 = deficits on all tests, visually obvious uni- or bilateral paralysis, and fails righting reflex test. The P-values shown represent the Kaplan–Meier statistical analysis result for comparisons of the genotypes at each disease stage/score as indicated on the y-axis. Animals that received a score of 0 were removed from the study and considered expired, and thus, the graph of mice with score = 0 is equivalent to a Kaplan–Meier survival curve.