
Figure 5.
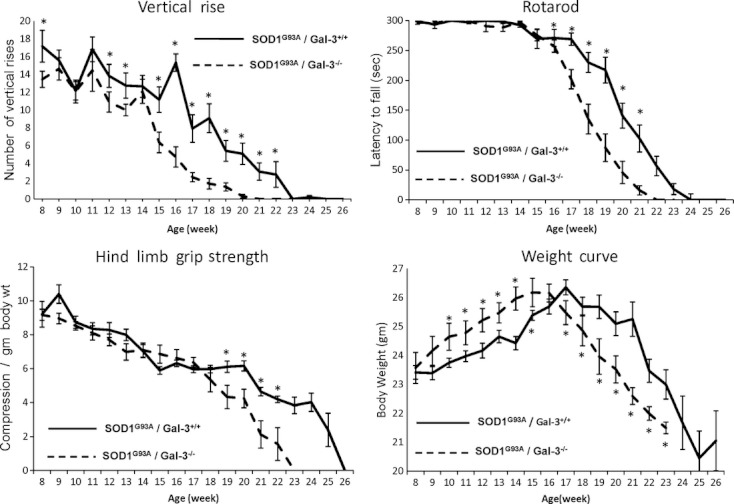
The C57BL6 SOD1G93A/Gal-3−/− phenotype (n = 12) displays greater functional impairment and weight loss than the C57BL6 SOD1G93A/Gal-3+/+ cohort (n = 12) during disease progression. Mean ± SEM scores of C57BL6 SOD1G93A/Gal-3−/− or C57BL6 SOD1G93A/Gal-3+/+ control mice are graphed over time for individual tests of motor function or body weight. The vertical rise score reflects the number of times animals reared up onto their hind limbs to explore during 3 min in an open field chamber. Rotarod and grip strength tests are detailed in Methods. For all, *P < 0.05 by two-way ANOVA followed by individual post hoc t-tests for each time point.