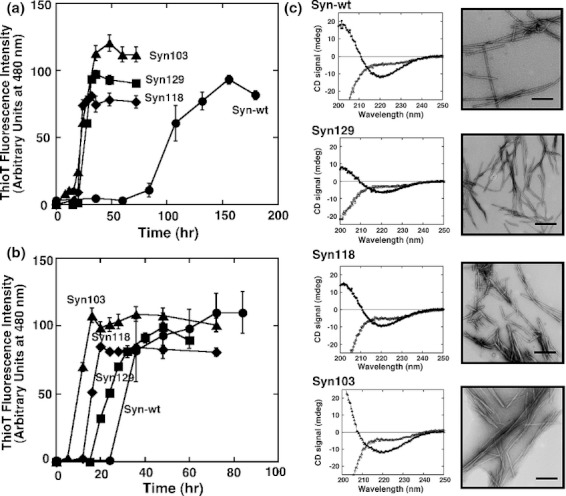
Figure 2.

Fibril formation characteristics of the C-terminal truncated mutants. (a) and (b) Amyloid fibril formation monitored by ThioT binding assay. Conditions were 1 mg/mL protein in 25 mmol/L Tris–HCl buffer, pH 7.5, containing 0 mol/L (a) and 150 mmol/L (b) NaCl, at 37°C. Closed circles indicate Syn-wt; closed squares, Syn129; closed diamonds, Syn118; closed triangles, Syn103. Standard error bars derived from at least three independent measurements are also shown. (c) CD spectra and TEM images of Syn-wt, Syn129, Syn118, and Syn103. In the CD spectra, open and closed symbols represent for samples before and after incubation for fibril formation, respectively. The scale bar in each panel of TEM image represents 200 nm.
