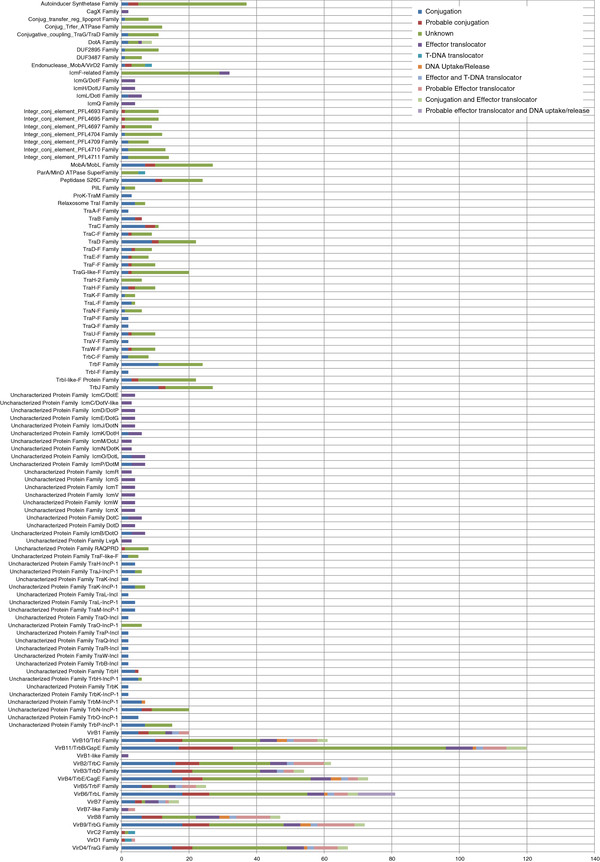
Figure 3.
Distribution of family sizes in the Atlas T4SS. The graphic shows the distribution of the 119 protein families annotated in the 2nd category of the Atlas T4SS according to the number of entries per family. The colors within each bar indicate the percentage of entries annotated with a known or unknown function.

