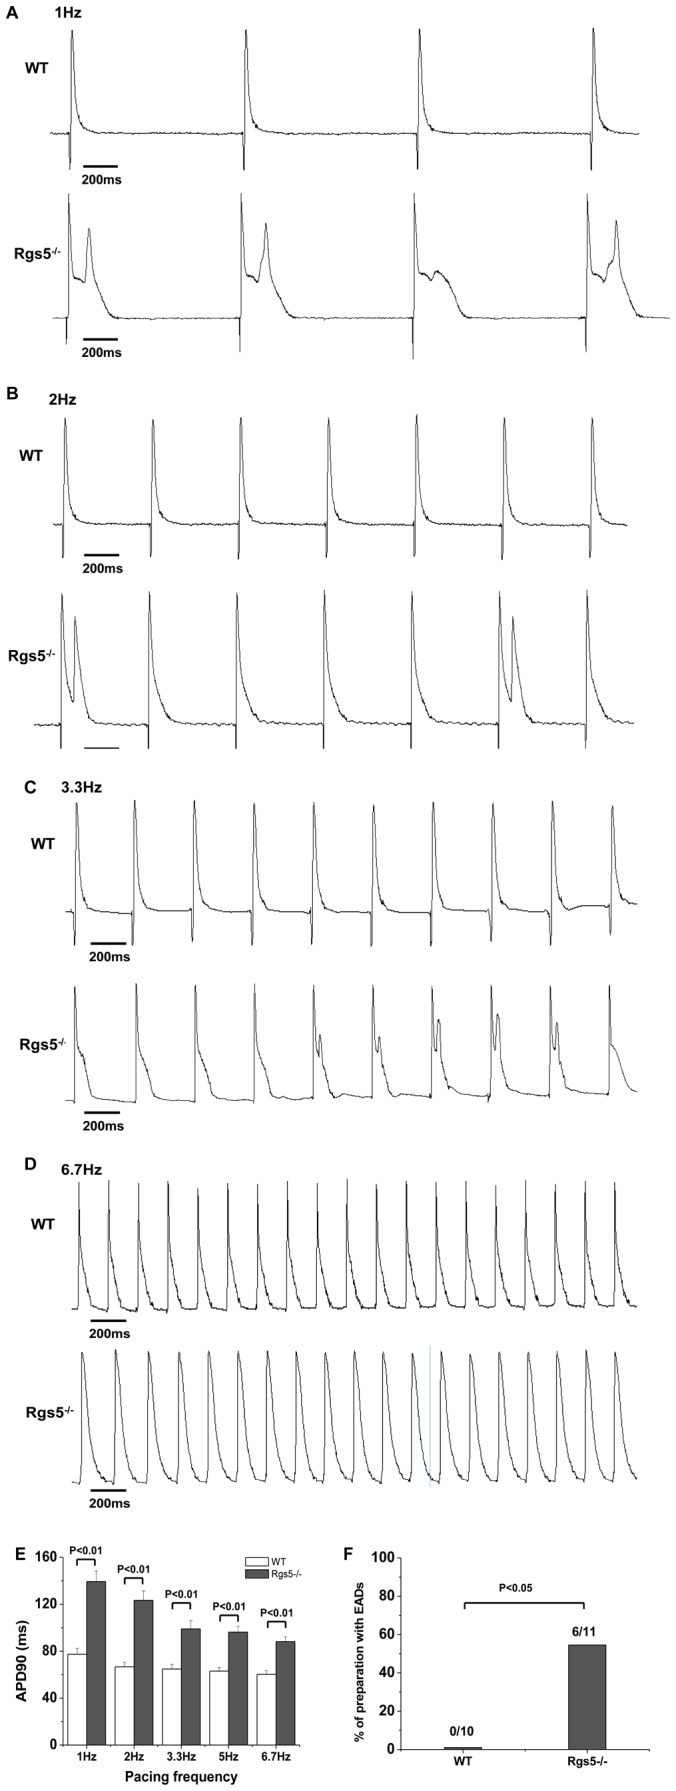
Figure 2. Transmembrane action potentials (TAP) from WT and Rgs5−/− atrial samples.

The TAP was recorded at paced frequency from 1 Hz to 6.7 Hz (A–D). Mean±SEM APD values at 90% repolarization (APD90) show APD prolongation at different pacing frequency (E). Early after-depolarizations (EADs) occurred in Rgs5−/− group at 1 Hz, 2 Hz and 3.3 Hz. EADs occurrence was quantified as percentage of preparations (F).
