
Figure 5. Alterations in K+ current were recorded in atrial myocytes of Rgs5−/− and WT mice.
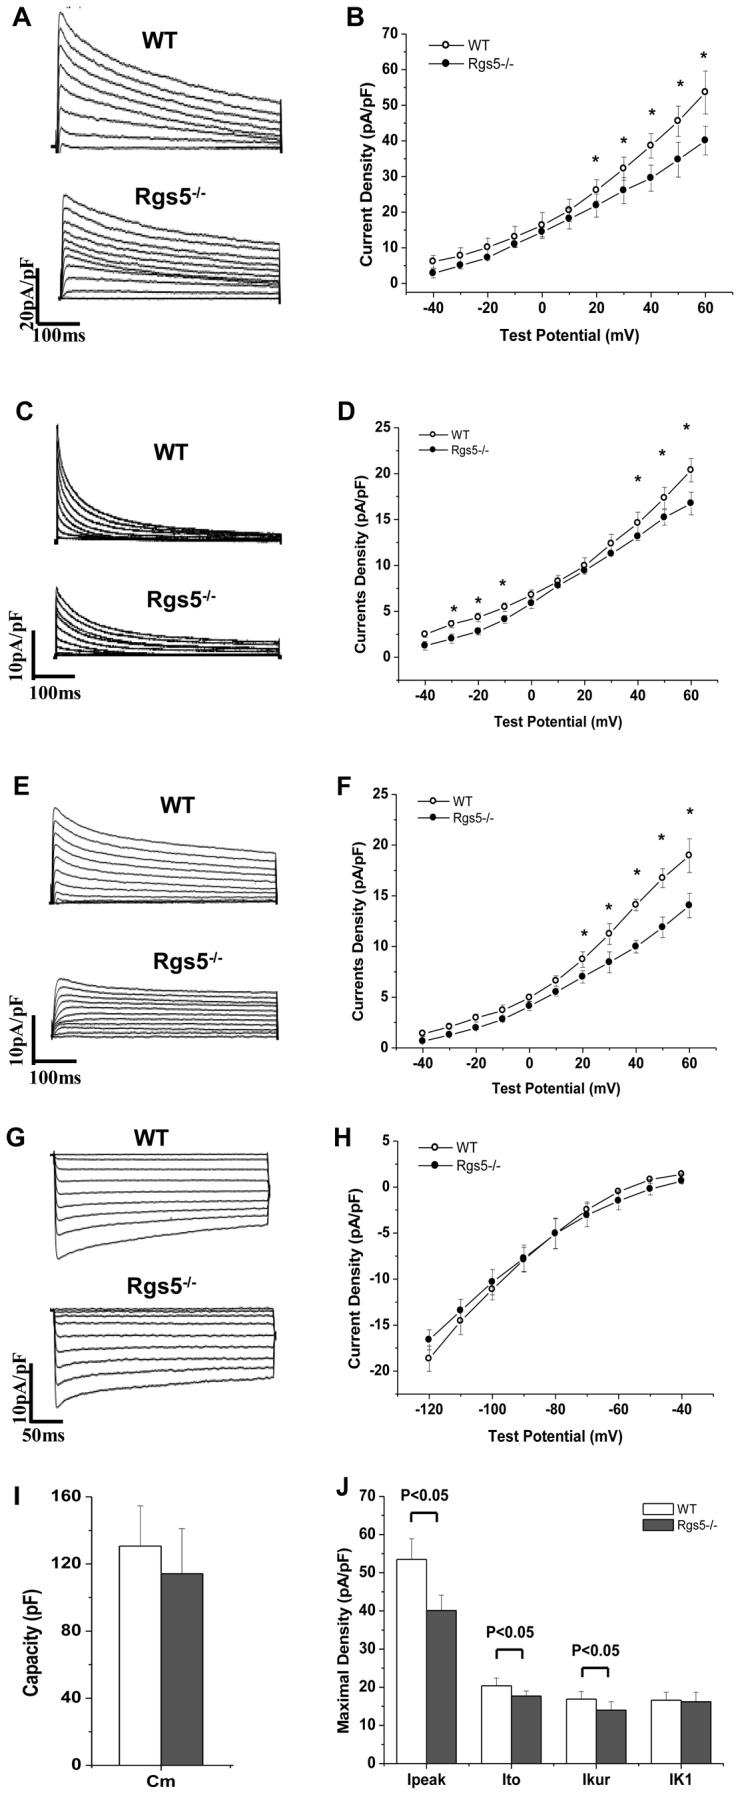
Representative whole-cell total outward K+ currents (Ipeak) (A,B), transient outward currents (Ito) (C, D) and ultra-rapid delayed rectifier currents (Ikur) (E, F) evoked during 500 ms test potential steps from −40 mV to +60 mV from a holding potential (HP) of −80 mV. The inwardly rectified K+ currents (IK1) (G, H), evoked during 350 ms voltage steps to potentials between −120 and −40 mV (HP = −80 mV). The current-voltage relationship (I–V) of Ipeak and IK1 were plotted (B, D). Membrane capacity (Cm) (I) and maximal densities of currents (J) were compared between wild-type and Rgs5−/− mice. *P<0.05 WT vs Rgs5−/−.