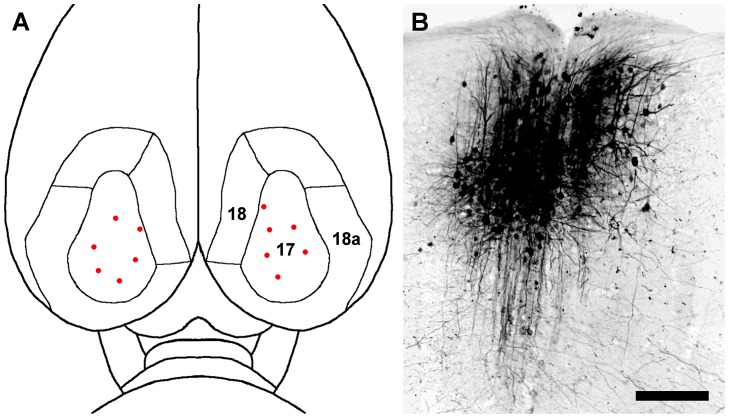
Figure 1. Typical bilateral BDA injection sites in the visual cortex.
(A) A dorsal view of the cortical visual areas of the rat brain, indicated by the numbers 17, 18 and 18a [36]–[38], is shown. The locations of multiple BDA injection sites are represented by red dots. (B) A photomicrograph in the coronal plane showing a typical site for a 0.1 µL injection of 3,000 MW BDA in cortical area 17. Scale bar: 3.0 mm in A, 125 µm in B.

