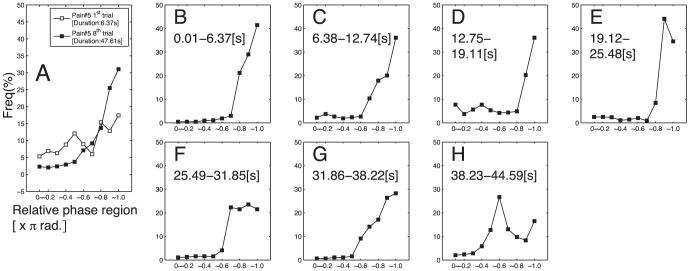
Figure 5. Distribution of instantaneous relative phase ( ) measured for the early-shortest and late-longest trials of a typical pair (#5).
A: Distributions calculated for all durations of early-shortest trials (blank square) and late-longest trials (filled square). B–H: Distributions calculated for each 6.37 s time series segments of a late-longest trial.

