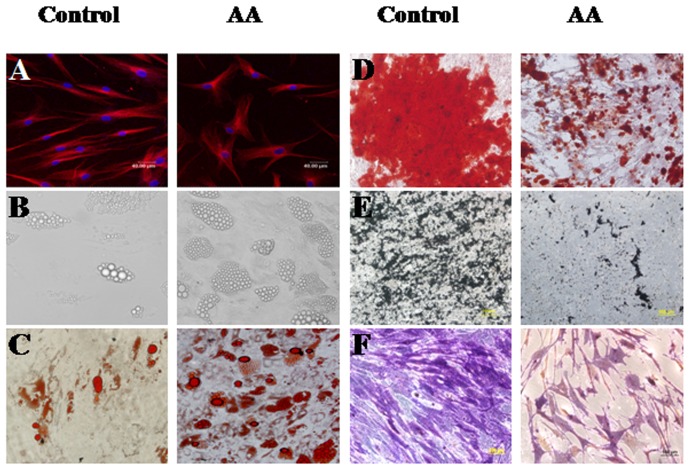
Figure 1. The representative morphology and multiple differentiation capacity of BM-MSCs from AA patients and healthy controls.
The morphology of BM-MSCs was shown after staining with β-tubulin (A). The adipogenic differentiation capacity of BM-MSCs detected by un-staining (B) and positive staining of Oil Red O (C). The osteogenic differentiation capacity of BM-MSCs detected by positive staining of Allizarin Red (D), von Kossa (E) and ALP (F).

