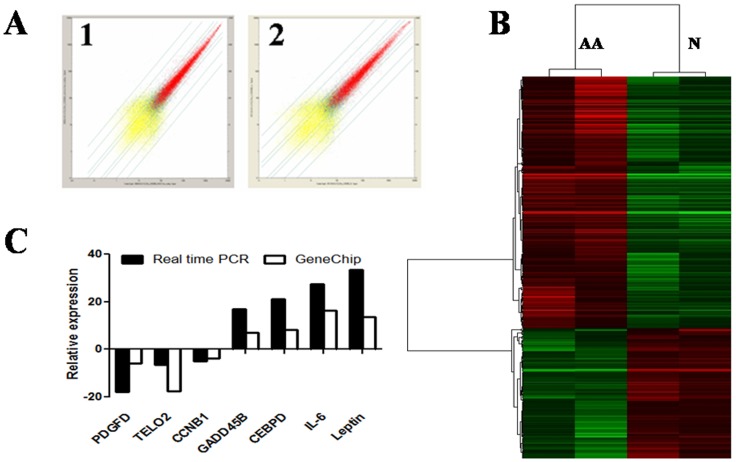
Figure 4. Global view of gene expression profile of BM-MSCs.
Gene expression profile of BM-MSCs was determined using Affymetrix oligoarrays. (A) The scatter plot for two biological replicates. (B) The comparison of cluster data between AA patients and healthy controls. (C) Validation of GeneChip results by quantitative real-time PCR. Data were relative to the amount of GAPDH.

