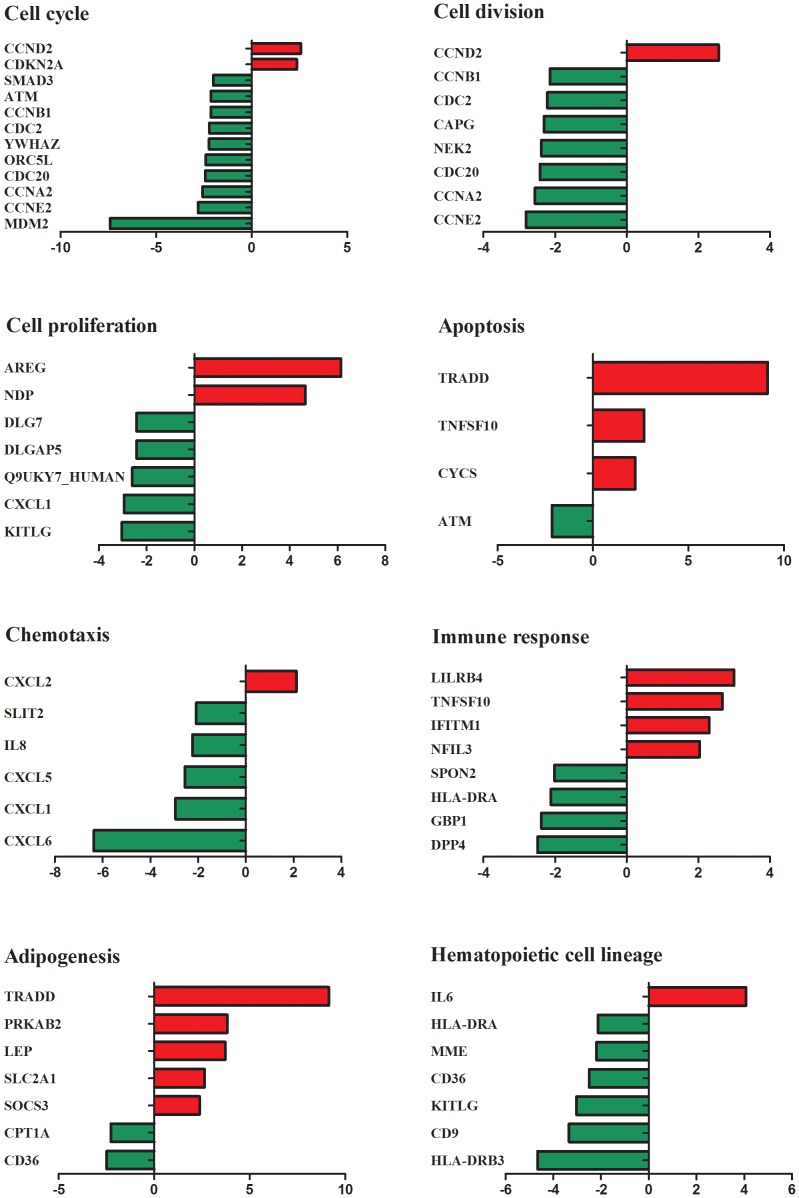
Figure 5. Gene expression patterns of BM-MSCs from AA patients in key biological signal pathways.
Gene expression patterns were grouped and displayed in the following categories: cell cycle, cell division, cell proliferation, apoptosis, chemotaxis, immune response, adipogenesis, and hematopoietic cell lineage. Relative genes expression were analyzed and compared between AA patients and healthy controls. Genes differentially expressed in BM-MSCs from AA patients were identified with at least a 2.0-fold change with respect to healthy control pools. The up-regulated genes are shown in red while down-regulated genes are shown in green.

