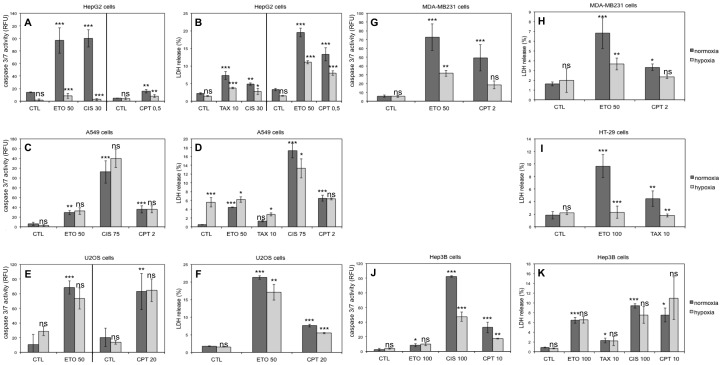
Figure 1. Effect of hypoxia on chemotherapeutic agents-induced cell death.
HepG2, A549, U2OS, MDA-MB231, HT-29, Hep3B and PC-3 cells were incubated under normoxia (21% O2) or hypoxia (1% O2) in the absence (CTL) or presence of etoposide (ETO), paclitaxel (TAX), cisplatin (CIS) or camptothecin (CPT) for 16 (A, C, E, G, J) or 40 hours (B, D, F, H, I, K). The concentration used for each molecule is indicated in the graphs (in µM). (A, C, E, G, J) Caspase-3/7 activity was assayed by measuring the fluorescence of free AFC released from the cleavage of the caspase-3/7 specific substrate Ac-DEVD-AFC. Results are expressed in relative fluorescent units (RFU) as means ±1 SD (n = 3). (B, D, F, H, I, K) LDH release was assessed. Results are presented in percentages as means ±1 SD (n = 3). (A-K) Statistical analysis was carried out with ANOVA 1. ns: non-significant; *: P<0.05; **: P<0.01; ***: P<0.001. Symbols above a normoxic column are a comparison with the normoxic control and symbols above a hypoxic column are a comparison with the corresponding normoxic condition (with the same drug).

