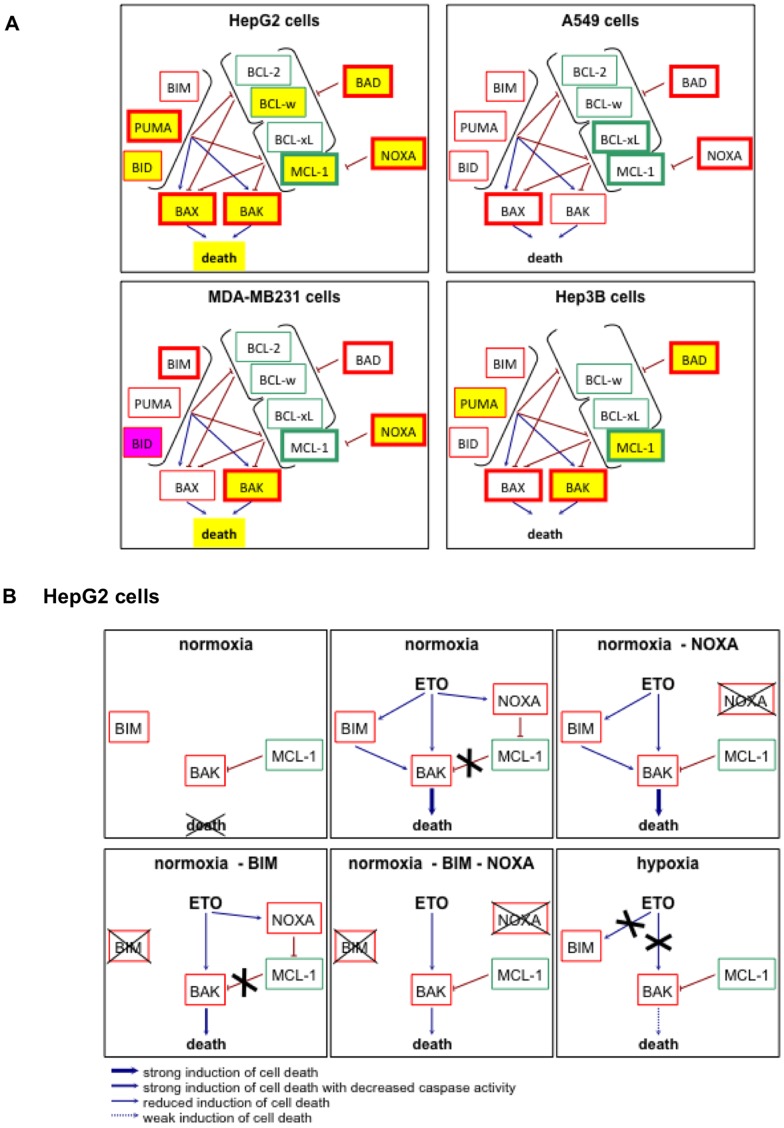
Figure 9. Schematic representation of the effects of hypoxia on the etoposide-induced effects on BCL2-family proteins.
(A) Schematic representation of the results obtained in figure 4. Anti-apoptotic proteins are represented outlined in green and pro-apoptotic proteins are outlined in red. The activation arrows and inhibition signs come from the hypothesis of the interactions between BCL-2 family proteins as explained in [69], [70]. The proteins whose abundance is increased by etoposide are outlined with a thicker line. A yellow filling represents that, in the presence of etoposide, hypoxia decreased the abundance of the protein (or the death) as compared to normoxia. A pink filling represents that, in the presence of etoposide, hypoxia increased the abundance of the protein as compared to normoxia. (B) Schematic representation of the hypothetic relations between BIM, BAK, MCL-1 and NOXA. These possible mechanisms are represented for normoxic (21% O2) or hypoxic (1% O2) HepG2 cells incubated with or without etoposide (ETO; 50 µM) and with or without silencing (−) of NOXA and/or BIM. The hypothetic relations between these proteins are explained in details in the text. Anti-apoptotic proteins are represented outlined in green and pro-apoptotic proteins are outlined in red.

