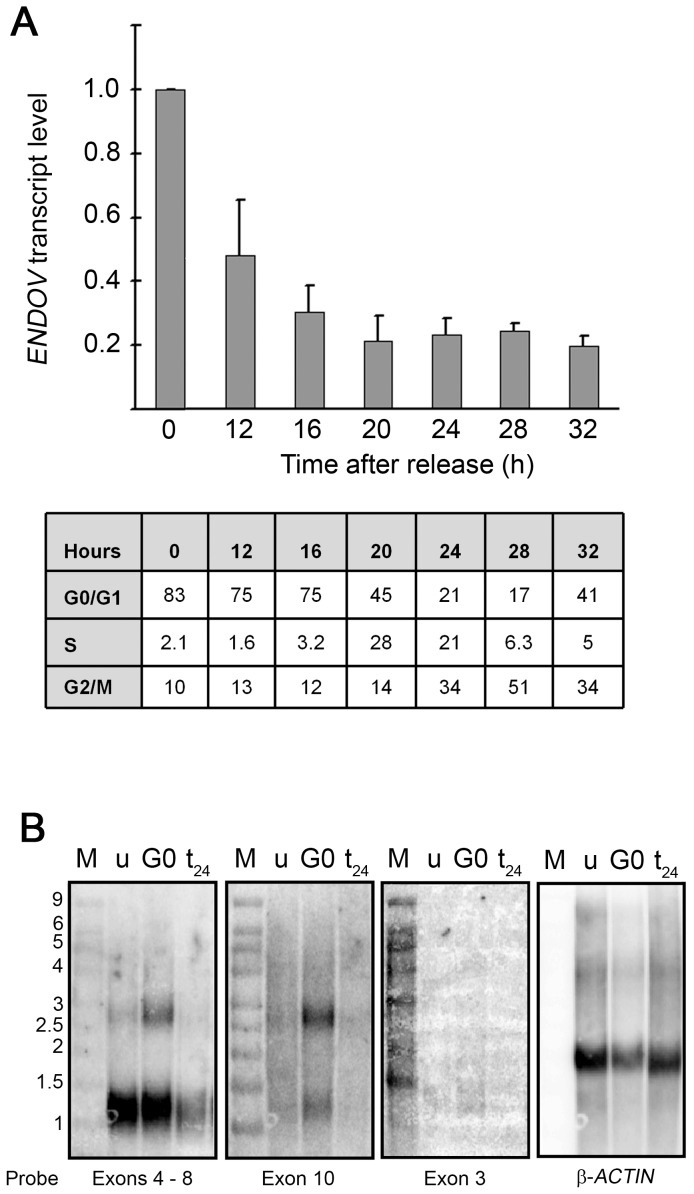
Figure 2. Upregulation of ENDOV transcription during quiescence.
(A) Human embryonic fibroblasts were arrested in G0 by serum starvation at confluence and released by replating 1∶4 in culture medium with serum. ENDOV transcript levels (exons 2 to 3) were measured during cell cycle progression after G0 release at indicated time points by qRT-PCR. G0 cells were used as the reference for calculations. The average of 3 parallels (same RNA) was calculated and standard deviation is shown. Cell cycle distribution was monitored using propidium iodide staining followed by flow cytometry after release from the block. The percentage of cells in each cell cycle is presented in the table. The experiment was repeated twice with similar results. (B) Nothern blot analysis of ENDOV mRNA. mRNA was isolated from human fibroblasts that were unsynchronised (u), G0 arrested (G0) and allowed to proliferate for 24 hours (t24), separated by electrophoresis and transferred to a nylon membrane. Hybridisation signals with probes spanning exons 4–8, exon 10, exon 3 of ENDOV and for β-ACTIN are shown. M is the RNA size standard as indicated (in kilobases).

